A team that seeks constant improvement needs to rely on concrete data, and not only on the results. While using metrics for their benefits, without intention to shape behaviors, the team may evolve. When it comes to using metrics, the right mindset is: if we don’t measure – we don’t know where we are. If we measure wrong, we might think we´re in one place, while in reality, we’re somewhere else. The conclusion here is simple – if the metric is irrelevant, there´s no point to measure.
How do metrics shape the behavior of the team?
If you measure only the speed of delivery of the product, as a result, you may get a very efficient team, but poor product quality. Your team is like a little boy looking at the ocean, who became brave after seeing a wave ebbing back. He ran towards the water not knowing that soon it will come back with a new, stronger wave and reach him. The same thing is happening with bugs. They come like a wave and scare the team. On the other hand, having efficient, high-performing team delivering products without value, is like sinking Titanic with the background violin music, sipping English tea meanwhile. With such a scenario, a doubt arises: what should we measure?
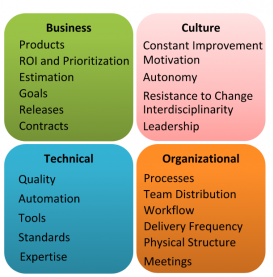
In 2014, one of the K21 founders, Rodrigo de Toledo, wrote an article “How far does Agility go?”. He presented there four main Domains of Knowledge in Agility (Business, Culture, Technical, Organizational), and showed how we could use them to carry out the analysis of teams and companies, as well as to define next steps of Digital Transformation. Those four domains are also a great way to maintain the balance of metrics, for which an Agile Team must always be on the lookout.
Domains of Knowledge in Agility

Business Metrics (Efficiency)
In this domain, metrics are directly linked to the business issues. If the team was created to resolve problems, these metrics will transform the Agile Team´s purpose into numbers, and measure the effectiveness of a chosen solution.
In Agile Methods, the product requirements usually described in the User Story format, shouldn’t be treated as an absolute certainty regarding the solution we are developing. In fact, the requirements are just hypotheses, that may or may not solve the problem. With every product launch, we must evaluate the effectiveness of the delivery. If you use the User Story format, these metrics will help you to measure whether So That has been reached.
User Story
As a <role>
I can <capability/desire>
So That <benefit>
Example:
As a regular client of X website, I desire a list of book recommendations, so that I´ll make a choice easily
We can say that the functionality was effective if it increased the number of sales of the books that were on the list of recommendations from regular customers of the site.
Objectives and Key Results (OKR) is an excellent technique not only to define metrics but also to define the expected target. The examples of metrics are Invoices, Cost, Attendance, Churn, Payback, Market growth, Net Promoter Score (NPS), Fitness For Purpose Score (F4P), Pirate Metrics (Awareness, Acquisition, Activation, Revenue, Retention, Referral), Social Sentiment, Sales, etc.
In Efficiency domain, metrics are linked directly to the team performance about product delivery. Their purpose here is to give work predictability, to highlight bottlenecks of the processes, and to assist both external and internal collaborations of the team. Kanban metrics provide great evidence of efficiency and might be obtained by analyzing User Stories. They are mapped according to the degree of importance on a particular activity board (Kanban Board, Scrum Board, Task Board, Time Board, or however you prefer to call it).
Examples: Lead Time, Cycle Time, Touch Time, Waiting Time, Work in Progress (WIP), KanbanFlow.
Technical Metrics (Quality)
These metrics are measuring technical quality of the product and indicate the amount of technical debt we´re creating throughout the development process.
Examples:
A technical debt of the product can be measured by:
– Failures – the number of bugs and number of users affected by them;
– Code – whether automated test covering the software is the complexity of the source code or its duplication
– Performance and security – referred to access load to the system, and number of instructions and simultaneous users, besides the consumption of CPU, memory and HD.
Cultural Metrics (Atmosphere)
In this case, metrics are measuring how satisfied the participants are with working in particular team or organization. The result is subjective and only for team information. It can´t be used for any kind of comparison between the teams. The metrics are so particular, that even the exchange of participants would probably change the result for better or worse. Sometimes we use Happiness Radar, which is helpful in evaluating some important aspects about the time, such as the processes, tools, and practices used in work, the relationship with colleagues, the personal satisfaction of belonging to the team, satisfaction in performing the work and so on. Another interesting technique, used by Spotify, is the Squad Health Check Model. There are also techniques, like Time NPS, Actions for the Nirvana Path, among many others.
Conclusion
The article presents several examples of techniques for each domain of knowledge in Agility, and vital here is to find a balance between them. However, you have to make a concrete decision about which technique you want to keep in which area. If the team pays attention to too many things, it will not pay enough attention to anything in particular. Just the right quantity of tools, to not make the team lost. Metrics should be few, easy to measure, easy to understand, relevant to the path that the team is seeking and easily influenced by the teams work.
